Your cart is currently empty!
PTM Analysis
Unprecedented insight into your samples.
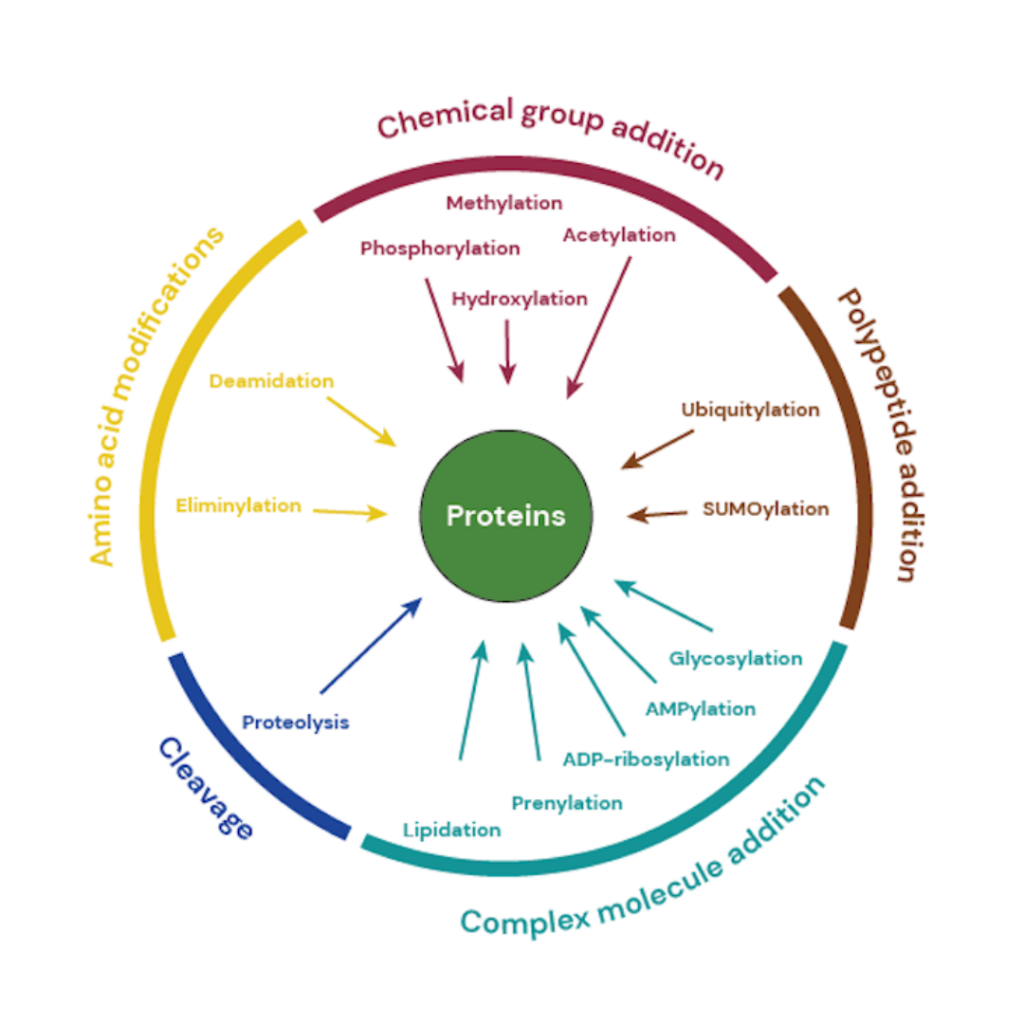
Post-translational modifications, or PTMs, are physical alterations that occur in a regulated manner to almost every protein after the initial translation.
Allumiqs Capabilities
Why study PTMs?
While the function of some PTMs is still unknown, scientists now understand that most of these modifications are implicated in the regulation of a plethora of biological processes such as cell survival, energy metabolism, and signal transduction, just to name a few. Mechanistically, PTMs are the way cells detect modifications in their environment, convey a signal to the appropriate organelle, and produce an adapted biological response to the stimulus.
PTMs are very broad in nature and can be reversible or irreversible. According to their impact on the target protein, PTMs can also be categorized into five distinct families.
- Phosphorylation
- Glycosylation
- Ubiquitination
- Methylation
- Lipidation
- S-nitrosylation
- N-acetylation
More Omics Capabilities
Multiomics
Get the big picture by combining proteomics, lipidomics and metabolomics data.
Metabolomics
Sample profiling using either untargeted metabolomics or selected panels of targeted metabolites is the best technique.
Lipidomics
Get in-depth profiling of many classes of biologically relevant lipids using our high resolution instruments.
Data Analytics
We help customers unlock the value and potential of their data with clearer, deeper insights.
Let’s connect
Get in touch with our experts