Your cart is currently empty!
Data-driven Solutions
Optimize your discovery, budget, and time-to-biomarker.
The key to success in translational research is generating deep, high-quality data. Drug development initiatives are twice as likely to succeed beyond Phase 2 when the data is good.
Let us help you reach your science and business goals using our powerful, field-tested multiomics approach to biomarker discovery.
unleash the power of collaboration
Biomarker discovery with actionable insights
We deliver in-depth and robust protein biomarker readouts. From functional insights to protein variants and a machine learning development model, our team ensures that the data we generate gets you to the next actionable step in your discovery pathway.
Our approach is species agnostic and unlike epitope-based technologies, it is truly unbiased.
- Species agnostic
- MI development models
- Unparalleled depth
- A wealth of insights
- Visualization of results

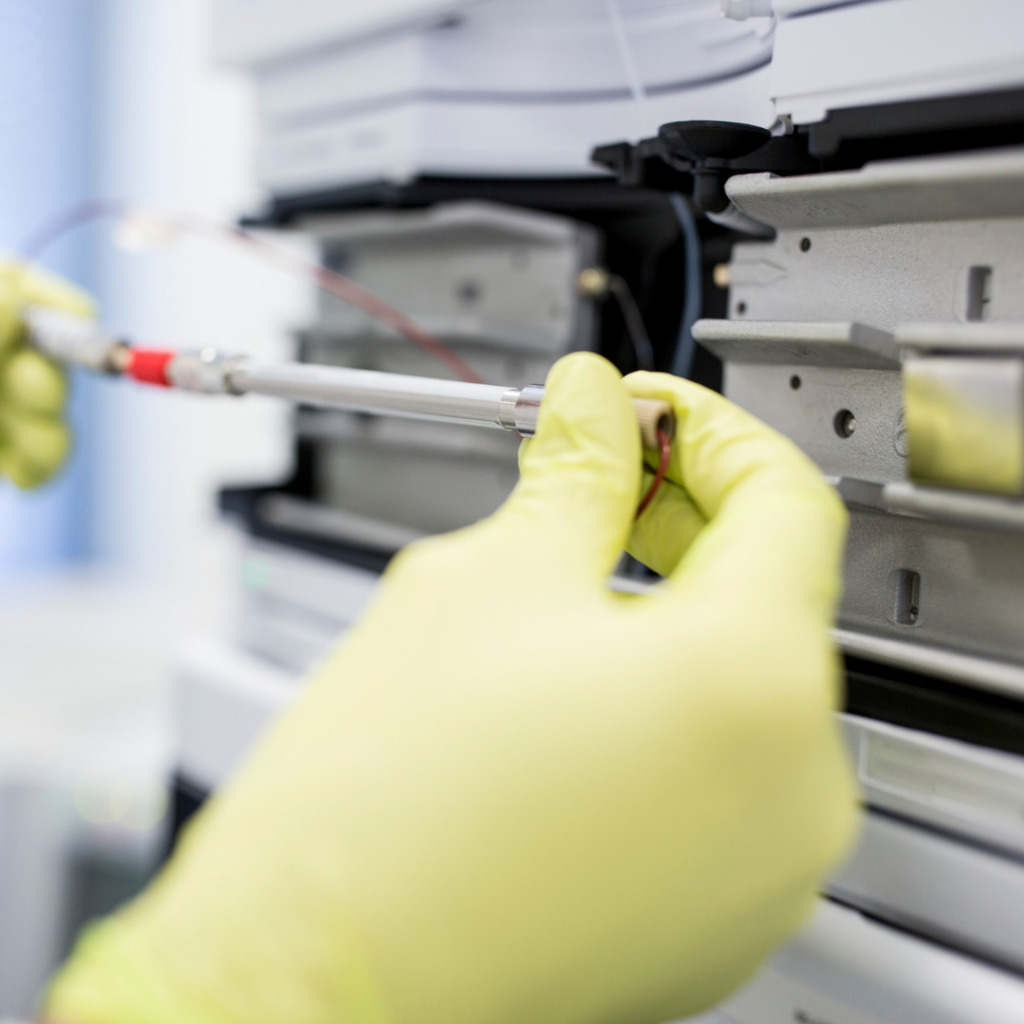
SWATH/DIA LC-MS/MS + ProTeograph XT
Detect +5000 proteins in plasma by LC-MS
We reproducibly quantify thousands of proteins and build data insights to advance your project using the Seer Proteograph™ XT Product Suite for automated sample preparation combined with SWATH™/DIA LC-MS/MS.
This approach uses nanoparticles to tackle the complexity of serum/plasma proteomics analysis and take you deeper into the proteome.
Most modern data acquisition strategies by LC-MS/MS will only identify 500 to 600 proteins in plasma. The Proteograph™ Product Suite uses nanoparticles that enable the compression of the dynamic range of protein concentrations in a highly reproducible fashion. This enables more than 18,000 detected features per sample that allow us to reproducibly (below 15% CV) quantify thousands of proteins across samples including protein isoforms, and even genetic variant pQTLs. For even more flexibility, we offer gradient options that translate into different yields in the total number of quantified peptides vs. throughput.
Why Work with US?
Scale out, not up to reach your discovery goals
Allumiqs has redefined CRO, we are an outsourced contract research optimizer and an ideal fit with rapidly scaling biopharma innovators.
We believe that omics, mass spectrometry, and technology are powerful tools that should be easily accessible to drive your discoveries forward. Our team has operationalized complex LC-MS based omics which enables us to work with you and your team as an extension of your lab. We are more than just a CRO, we want to be your collaborator in science and in business.

Capabilities & Technology
Tap into cutting-edge technologies
We put our multiomics – proteomics, metabolomics, and lipidomics – expertise to work for you in biomarker discovery solutions. We also apply assay development, and quantitative profiling skills and know-how to work for you.
Our solutions are powered by the latest omics and mass spectrometry technology available, including the Seer Proteograph™ XT Product Suite, SCIEX ZenoTOF 7600, and Thermo Scientific Orbitrap Exploris™ 480 Mass Spectrometer.
Let’s Connect
Get in touch with our experts